

Facility cleaning KPIs are measurable metrics that quantify cleaning quality, responsiveness, cost efficiency, and tenant satisfaction in commercial properties. These performance indicators give facility managers and property supervisors the data they need to hold cleaning teams accountable, justify budgets, and catch problems before tenants notice them. The industry standard for cleaning quality measurement draws from frameworks like the ISSA Clean Standard, digital audit platforms, and KPI dashboards that track everything from spill response times to cost per square meter. If you manage a commercial building without tracking these numbers, you are managing by assumption.
1. What are the most critical facility cleaning KPIs to track?
The most important facility cleaning KPIs fall into four categories: quality, responsiveness, cost, and tenant satisfaction. Each category captures a different dimension of cleaning performance, and gaps in any one of them will show up in tenant complaints or contract disputes.
Audit pass rate is the percentage of inspections where a facility scores 90% or higher against a defined standard. The target audit pass rate is 95% or above, with typical scores ranging from 85–95%. A score below 90% signals a systemic issue, not a one-off miss.
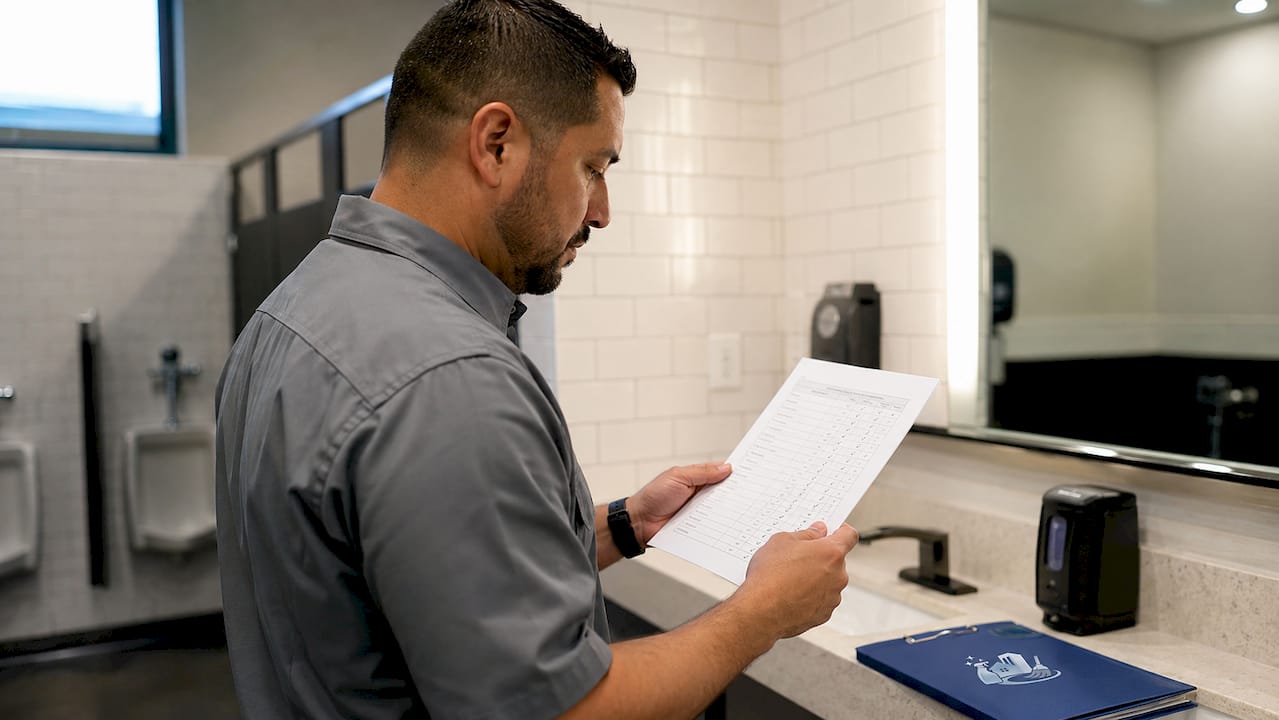
Defect rate measures the number of cleaning failures per inspection cycle. Tracking defects by zone (restrooms, lobbies, break rooms) tells you exactly where your cleaning program is breaking down.
Response time is one of the most tenant-visible KPIs you can track. Complaints should be resolved within 2 hours and spills addressed within 15 minutes. Missing these windows creates safety risks and damages tenant trust fast.
Tenant complaint rate should stay below 0.5 complaints per 1,000 square meters per month. A customer satisfaction score (CSAT) of 85% or higher confirms your cleaning program is meeting occupant expectations.
Cleaning cost per square meter tracks what you spend to clean each area of your facility. Without this number, you cannot compare vendor bids, justify budget increases, or identify where money is being wasted.
Scheduled task completion rate measures the percentage of planned cleaning tasks that were actually completed on time. A rate below 95% means your schedule is either understaffed or poorly designed.
Corrective action closure rate tracks how quickly identified defects are fixed. An open corrective action that sits unresolved for more than 48 hours is a red flag in any performance review.
Pro Tip: Start with audit pass rate, response time, and complaint rate as your first three KPIs. These three metrics cover quality, speed, and satisfaction without overwhelming your team in the first 90 days.
2. How to implement cleaning KPI tracking systems in your facility
Implementing cleaning performance metrics requires a structured approach. Jumping straight to a 12-metric dashboard before you have baseline data is a common mistake that leads to inconsistent numbers and staff resistance.
-
Start with three core KPIs. Leading FM professionals recommend beginning with 3 key metrics before adding cost and satisfaction indicators. Reactive versus planned work ratio, scheduled task completion rate, and audit pass rate give you a reliable foundation.
-
Deploy digital inspection tools. Paper checklists produce inconsistent data. Digitized inspection tools with timestamped QR code sign-offs and photo evidence standardize your audits and support immediate corrective actions. Tools like OX Maint, Facilities Management eXpress (FMX), and ServiceChannel all offer mobile audit modules.
-
Set up automated escalation workflows. When a task is missed or a complaint goes unacknowledged past the 2-hour window, your system should automatically notify a supervisor. Manual follow-up is too slow and too inconsistent.
-
Build a reporting dashboard for leadership. Your executive team needs four numbers: audit pass rate, complaint trend, CSAT score, and cost per square meter. Keep the dashboard simple and update it weekly.
-
Expand metrics after 90 days. Once your baseline data is stable, add zone-level cost tracking, corrective action closure rates, and preventive maintenance compliance. Expanding too early produces noise, not insight.
Pro Tip: Run a 30-day pilot in one building zone before rolling out your KPI system facility-wide. Pilots expose data gaps and workflow issues before they become organization-wide problems.
3. Comparing quality, cost, responsiveness, and satisfaction KPIs
Facility managers view cleaning KPIs as a composite score balancing competing priorities rather than isolated numbers. A team that scores 98% on audit pass rate but generates 2.0 complaints per 1,000 square meters is not performing well. The numbers need to be read together.
A weighted KPI scoring model assigns percentage importance to each category. A common model used in contractor performance reviews looks like this:
| KPI category | Weight | Target | Impact if missed |
|---|---|---|---|
| KPI achievement (overall) | 40% | 95%+ tasks completed | Contract penalty risk |
| Defect rate | 25% | Below 5% per audit cycle | Tenant complaints spike |
| Survey satisfaction (CSAT) | 20% | 85%+ positive responses | Lease renewal risk |
| Safety and compliance | 15% | Zero safety incidents | Regulatory exposure |
This weighted KPI scoring model ensures that a contractor cannot hide poor satisfaction scores behind a strong audit pass rate. Every category contributes to the final performance score.
Zone-level cost tracking adds another layer of precision. Breaking down cleaning costs by restrooms, kitchens, and common areas reveals cost drivers that aggregate data masks entirely. A facility spending $0.85 per square meter overall might be spending $2.40 per square meter in restrooms, which signals a staffing or scheduling problem specific to that zone.
Composite scoring also works well in vendor evaluations. You can review cleaning vendor performance against weighted KPI targets and make contract renewal decisions based on data rather than gut feel.
4. What are the top challenges in measuring facility cleaning KPIs?
The biggest obstacle in cleaning KPI tracking for facilities is inconsistent data. When one supervisor uses a paper checklist and another uses a mobile app, you cannot compare results or spot trends. Standardization is not optional.
Common challenges facility managers face:
- Paper-based audits that produce subjective, unverifiable scores
- No standardized inspection criteria across shifts or zones
- Too many metrics tracked at once, making it impossible to act on any of them
- Cleaning schedules that do not reflect actual foot traffic patterns
Solutions that work in practice:
- Replace paper audits with digital tools that require photo evidence and timestamps
- Adopt a single inspection standard across all zones, such as the ISSA Clean Standard
- Limit your initial KPI set to three metrics and expand only after 90 days of stable data
- Adjust cleaning schedules based on occupancy data, not fixed time blocks
Regular trend analysis and supervisor accountability in KPI reviews address recurring issues before they become patterns. A supervisor who reviews defect trends weekly will catch a problem in one zone before it spreads to three.
Foot traffic is an underused input in cleaning schedules. A lobby that handles 800 people per day needs a different cleaning frequency than one handling 200. Matching your schedule to actual usage reduces both defect rates and unnecessary labor costs. You can find practical scheduling frameworks in this building cleanliness guide for 2026.
Pro Tip: If your team is overwhelmed by KPI data, cut the list in half. Five KPIs tracked consistently outperform fifteen KPIs tracked sporadically every time.
Key takeaways
Effective facility cleaning KPIs require a balanced composite score across quality, responsiveness, cost, and tenant satisfaction, tracked with digital tools and reviewed consistently.
| Point | Details |
|---|---|
| Start with three KPIs | Track audit pass rate, response time, and complaint rate before adding complex metrics. |
| Use weighted composite scoring | Assign percentage weights to quality, defect rate, satisfaction, and safety to prevent tunnel vision. |
| Track costs at zone level | Break down cost per square meter by restroom, kitchen, and common areas to find hidden inefficiencies. |
| Digitize your audits | Timestamped QR sign-offs and photo evidence replace subjective paper checklists with verifiable data. |
| Expand metrics after 90 days | Build stable baseline data on three core KPIs before adding satisfaction and cost indicators. |
Why I stopped chasing perfect audit scores
The first time I reviewed a facility's cleaning KPI report that showed a 97% audit pass rate alongside a 1.8 complaint rate per 1,000 square meters, I realized the numbers were telling two different stories. The audits were passing because the inspections were happening right after cleaning shifts. The complaints were coming in two hours later when occupants actually used the spaces.
That experience changed how I think about cleaning performance metrics entirely. A single KPI, no matter how strong, is not a performance picture. It is one frame. The composite scoring model exists precisely because facilities are complex environments where one metric can look excellent while another is quietly failing.
The other thing I have learned is that tenant satisfaction is the most honest leading indicator you have. Tenants do not complain about abstract audit scores. They complain about what they see, smell, and touch. A CSAT score trending downward is almost always ahead of an audit score decline by two to four weeks. Watch it closely.
Digital tools have made real-time KPI tracking genuinely practical for mid-size facilities. The shift from paper audits to mobile inspection platforms with photo evidence has removed most of the subjectivity that used to make cleaning quality data unreliable. If you are still running paper audits in 2026, you are working with a handicap. The commercial cleaning standards your tenants expect have moved well past what paper can verify.
Start small, stay consistent, and let the data tell you where to look next.
— Sales
How Sparkleprocommercialcleaning supports KPI-driven facility cleaning
Sparkleprocommercialcleaning delivers commercial cleaning services built around the same performance benchmarks covered in this guide. From Massachusetts commercial cleaning to Washington facilities, every engagement includes quality audits, digital reporting, and clear performance targets aligned with your facility's operational goals. Property managers in Delaware, New Jersey, and South Carolina rely on Sparkleprocommercialcleaning for consistent, measurable results across office buildings, retail centers, and healthcare facilities.
If you want a cleaning partner who tracks performance the same way you do, Sparkleprocommercialcleaning is ready to deliver.
FAQ
What are facility cleaning KPIs?
Facility cleaning KPIs are measurable performance indicators used to evaluate cleaning quality, responsiveness, cost, and tenant satisfaction in commercial properties. Common examples include audit pass rate, complaint rate, response time, and cost per square meter.
What is a good audit pass rate for commercial cleaning?
A target audit pass rate is 95% or higher, based on inspections scoring 90% or above against a defined standard like the ISSA Clean Standard. Scores below 90% typically indicate a systemic cleaning failure rather than an isolated incident.
How many KPIs should a facility manager track at once?
Start with three core KPIs and expand after 90 days once baseline data is stable. Beginning with a limited set of metrics prevents data overload and produces more reliable initial benchmarks.
What is a weighted KPI score in facility cleaning?
A weighted KPI score assigns percentage importance to each performance category, such as 40% for overall KPI achievement, 25% for defect rate, 20% for tenant satisfaction, and 15% for safety compliance. This model prevents strong scores in one area from masking poor performance in another.
How do digital tools improve cleaning KPI measurement?
Digital inspection tools with timestamped QR code sign-offs and photo evidence replace subjective paper checklists with verifiable, real-time data. This approach standardizes audits across shifts and zones, making corrective action tracking faster and more consistent.